
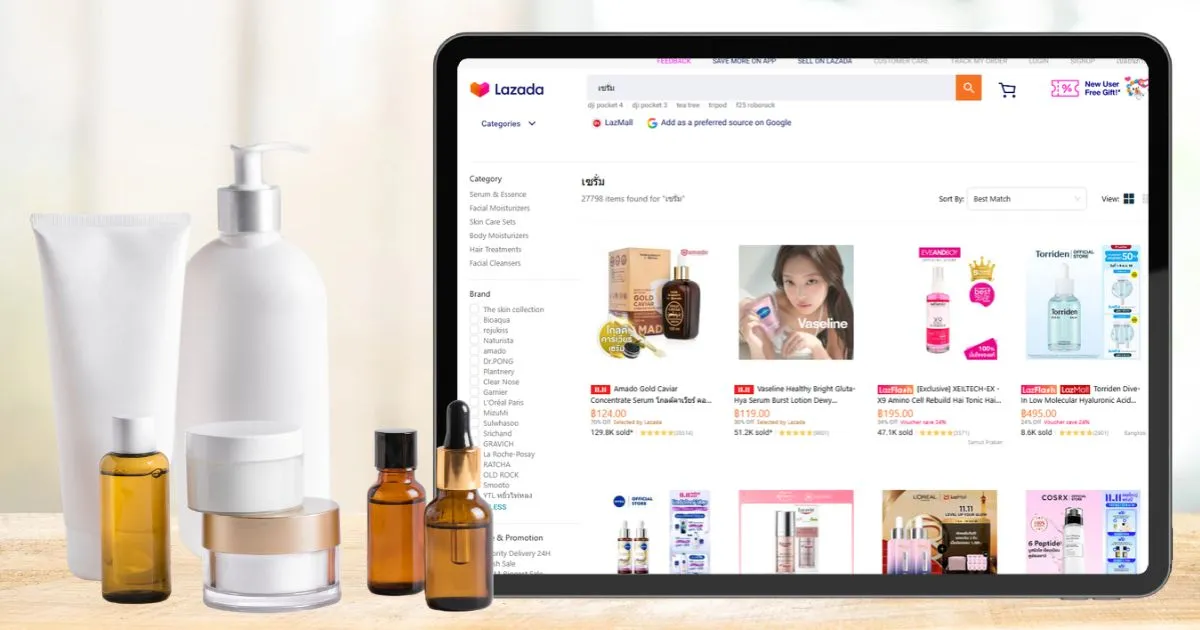



Competition in online marketplaces is not measured solely by sales volume and pricing, but also by a brand’s ability to consistently maintain product rankings on search result pages.
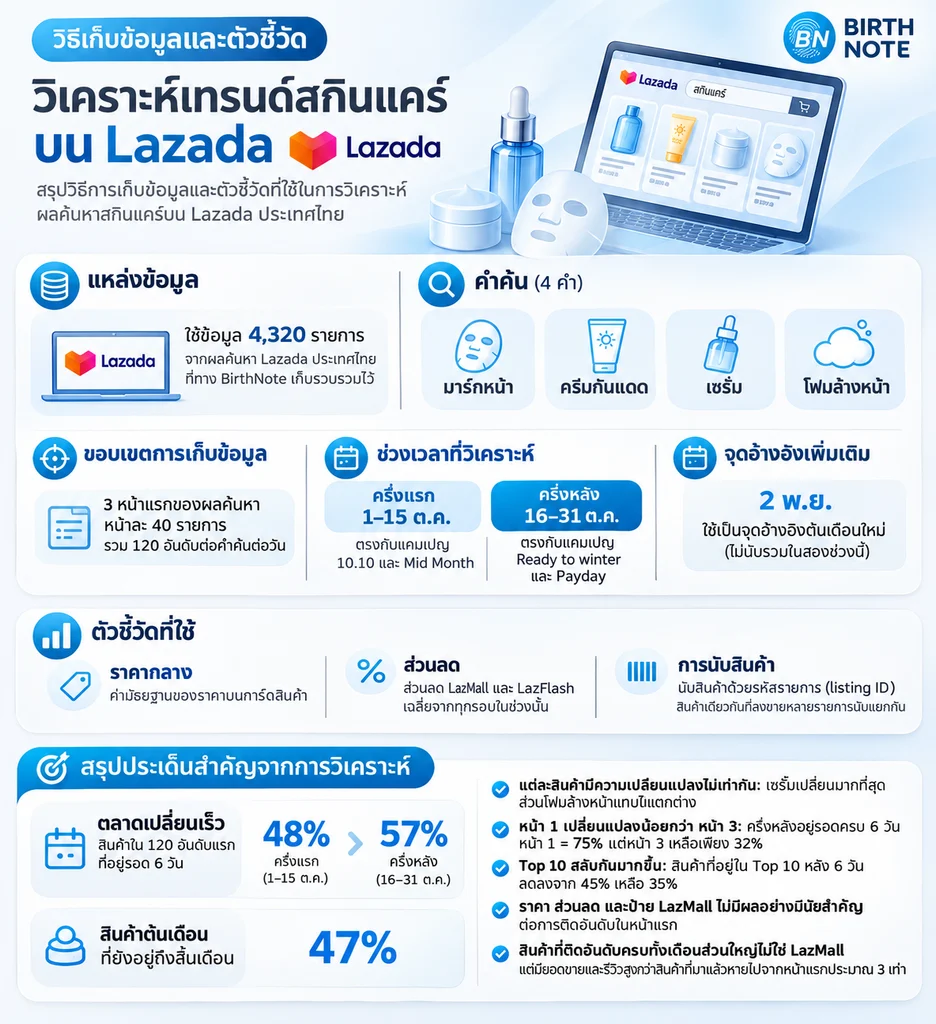
Birth Note analyzed product search result data on Lazada Thailand throughout October 2026, covering 4 major categories: Facial Masks, Sunscreens, Serums, and Facial Cleansing Foams—totaling 4,320 items. The study explores rank movements, pricing, discounts, and key factors involved in maintaining top positions.
Is High Sales Performance Enough? When the Skincare Battlefield Evolves Faster Than Ever
Imagine your brand’s product showing up prominently on the search results page yesterday, only for customers to no longer find it in that same position just a few days later. This issue isn’t exclusive to small brands—even products ranked in the Top 10 experience continuous shifts in position.
Based on tracking search results across four skincare search terms on Lazada Thailand, only 48.1% of the top 120 ranked products retained their positions after six days during the first half of the month. That figure rose to 56.7% in the second half of the month.
The key question for brand owners, therefore, isn’t just “What rank is our product at?” but rather “When does our ranking change, which competitors are climbing up, and how should we adjust our strategy during campaign periods?”
4 Key Insights Revealed by Marketplace Data
1. Overall Rankings are Stabilizing, but Top 10 Competition is Intensifying
The 1-day search retention rate rose from 68.1% to 81.2%, and the 6-day survival rate increased from 48.1% to 56.7%. However, only 35% of products managed to maintain their Top 10 positions after 6 days in the second half of the month, down from 45% in the first half.
This reflects that even though many products manage to stay within the general search results, the race to reach the very top spots shifts rapidly. Brands should monitor both overall “search presence” and their “position relative to competitors.”
2. Search Page 1 is a Battleground Brands Must Track Closely
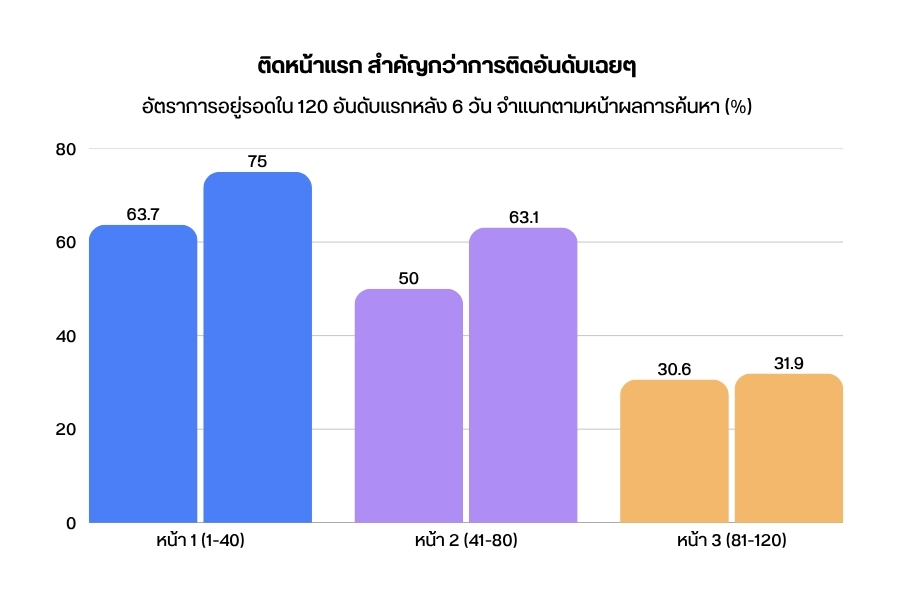
Products on Page 1 show a significantly higher survival rate than those on Page 3. In the second half of the month, products on Page 1 (ranks 1–40) achieved a 75.0% 6-day survival rate, compared to just 31.9% for products on Page 3 (ranks 81–120). This gap demonstrates that merely remaining within the top 120 overall is not enough to accurately evaluate a brand’s actual visibility.
Key Takeaway: Ranking on Page 1 significantly boosts visibility, but it does not guarantee position retention. Brands must monitor product rankings continuously.
3. Serums Exhibit the Highest Volatility, While Cleansing Foams Remain Relatively Stable
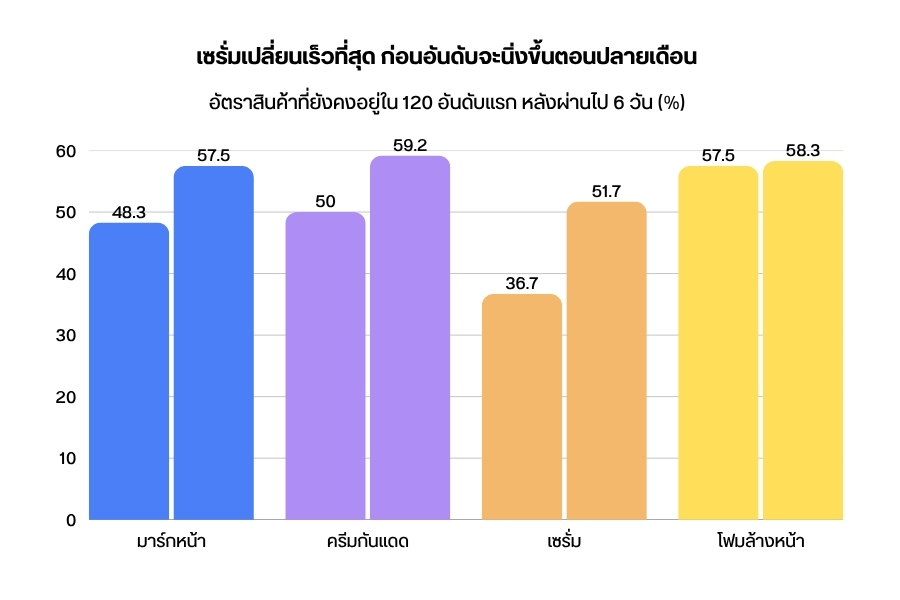
Comparing across all four search terms, serums recorded the lowest 6-day survival rate in the first half at just 36.7%, before rising to 51.7% in the second half (a 15.0 percentage point increase). Meanwhile, cleansing foams saw virtually no change, shifting slightly from 57.5% to 58.3% (a 0.8 percentage point increase).
Consequently, applying a single blanket marketplace strategy across all product categories may not be effective. Brands should monitor dynamics tailored specifically to their own search terms and product categories.
4. Products with Long-Term Retention Typically Possess Higher Review Bases and Cumulative Sales
When comparing 129 products that retained their rankings across all 8 tracking rounds in October—which recorded a median of 1,500 “units sold” and 392 reviews—against 380 products that appeared in only a single round (recording medians of 457 units and 108 reviews, respectively):
Products with continuous rank retention boast median cumulative sales and review counts that are approximately 3 times higher than those appearing only once.
|
Metric |
Products Retained Across All 8 Rounds |
Products Appearing in 1 Round Only |
|---|---|---|
|
Cumulative Sales (Median) |
1,500 units |
457 units |
|
Number of Reviews (Median) |
392 reviews |
108 reviews |
|
Best Rank (Median) |
Rank 21 |
Rank 89 |
|
LazMall Seller Ratio |
14% |
29% |
|
Median Price |
66 THB |
83 THB |
|
Average Discount |
52.5% |
47.8% |
Looking at the data from the table above, an interesting finding is that the continuously ranked group had a LazMall badge proportion of 14%, whereas the single-appearance group stood at 29%. This data set indicates that holding an official store badge is not the sole requirement for continuous search placement.
While possessing a LazMall badge alone does not guarantee position retention—given that the single-appearance group actually carried a higher proportion of LazMall tags—it is worth noting that these figures reflect observed correlations between variables, rather than direct proof that reviews, sales volume, or store badges serve as the direct cause of improved rankings.
Deep Dive into 4 Skincare Categories: Which Segment is the Most Competitive?
1. Facial Masks: Unbranded Products Still Play a Major Role
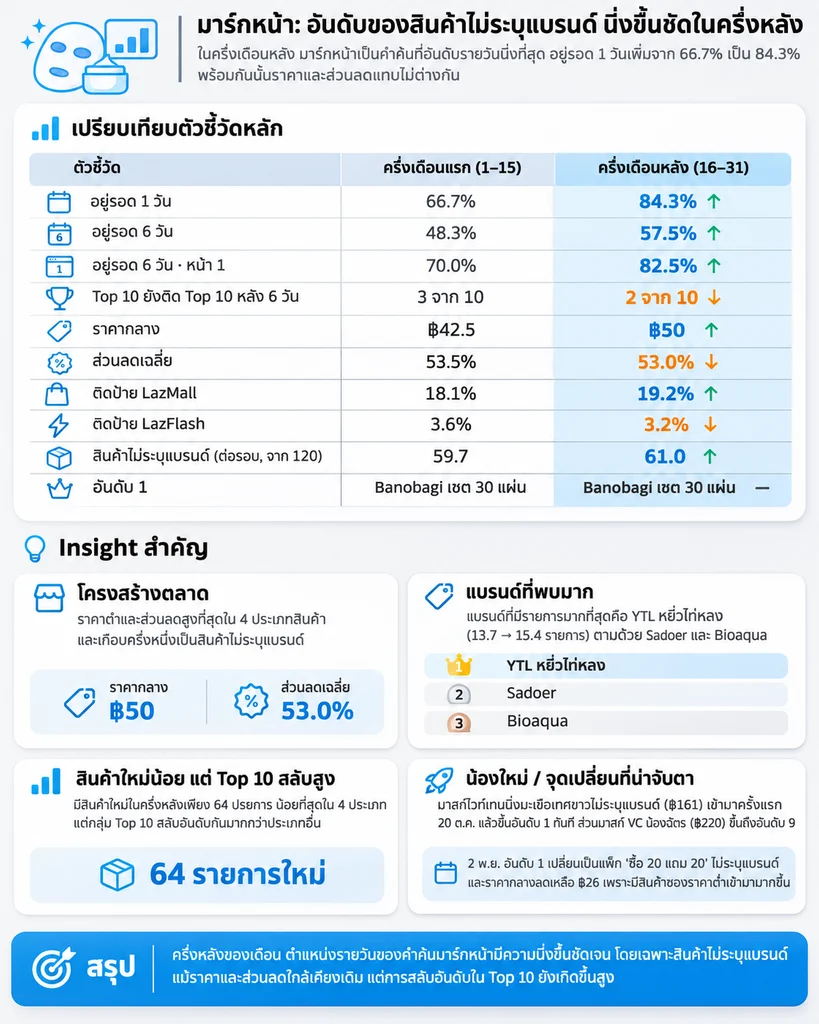
The median price for the facial mask category increased from 42.5 THB to 50 THB, with average discounts holding steady at around 53% across both periods. The 1-day survival rate rose from 66.7% to 84.3%, yet the Top 10 retention rate after 6 days dropped from 3 out of 10 down to 2 out of 10. Unbranded products held a high share, accounting for roughly 60–61 out of the top 120 listings. Frequently appearing brands included YTL, Bioaqua, and SENKA, alongside new entries like a white tomato mask that surged all the way to #1 on October 20th.
For Brands: The facial mask market faces intense price competition and high listing volume. Brands should not overlook new or unbranded items; monitor similarly priced products, bundle promotions, and fast-climbing listings—not just major industry players.
2. Sunscreens: Premium Brands Surge During Payday
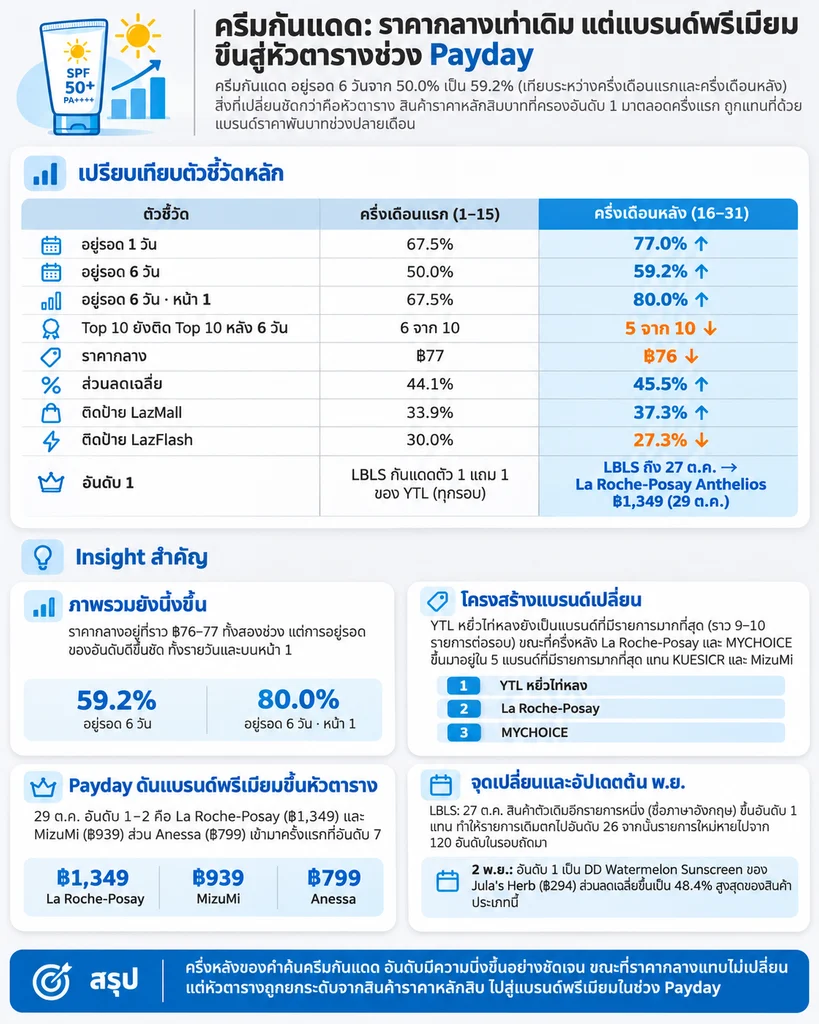
The median price for sunscreens remained virtually unchanged (77 THB vs. 76 THB). However, on October 29th, La Roche-Posay (priced at 1,349 THB) captured the #1 spot, followed by MizuMi (939 THB) at #2 and Anessa (799 THB) at #7.
For Brands: Tracking rankings only on non-campaign days can cause you to miss critical signals. Mega-sale and Payday events offer premium brands a strong window to boost visibility. Brands should track rivals across both their core price tier and the premium segment.
3. Serums: The Most Volatile Category
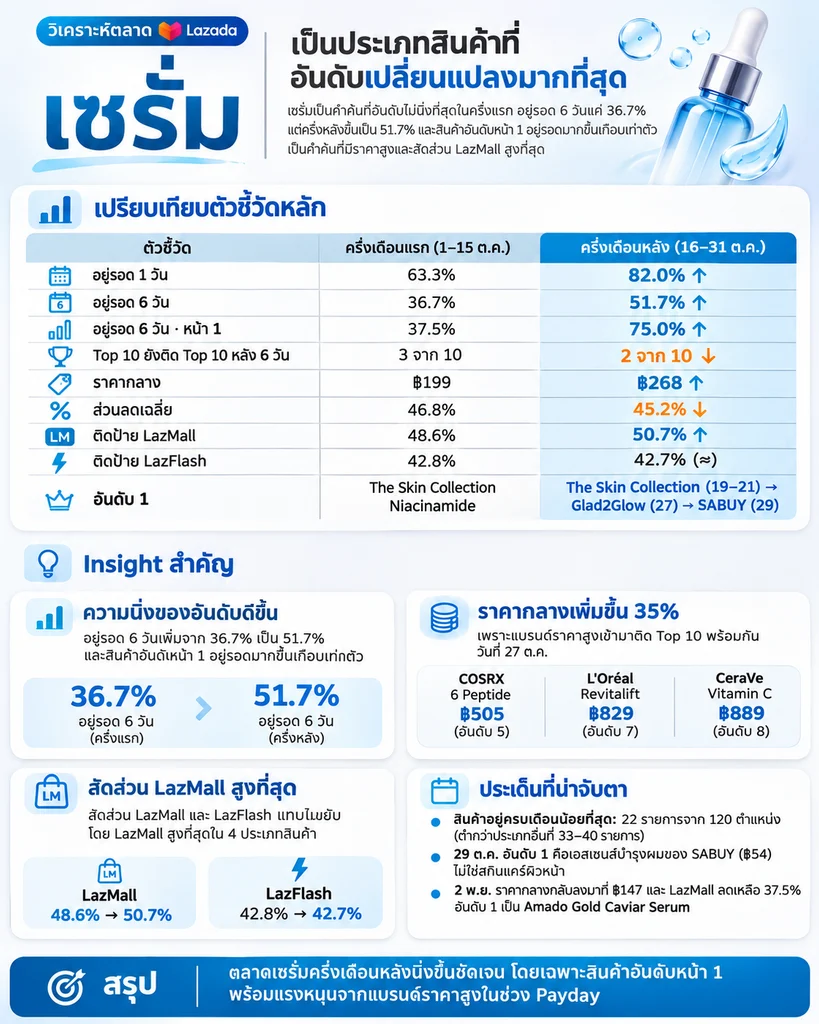
Serums recorded the lowest survival rate in the first half of the month at 36.7%, before recovering to 51.7% in the second half. Median prices jumped from 199 THB to 268 THB (+~35%). This category also featured the highest LazMall seller ratio among all 4 search terms, ranging from 48.6% to 50.7%. Toward the end of the month, COSRX, L’Oréal, and CeraVe broke into the Top 10. However, generic searches for “serum” still contained hair care listings, such as a SABUY hair essence that reached #1 on October 29th.
For Brands: Segment search term analysis by actual consumer buyer intent (e.g., “facial serum” or specific active ingredient names) to benchmark against direct competitors more accurately.
4. Cleansing Foams: The Most Stable Category
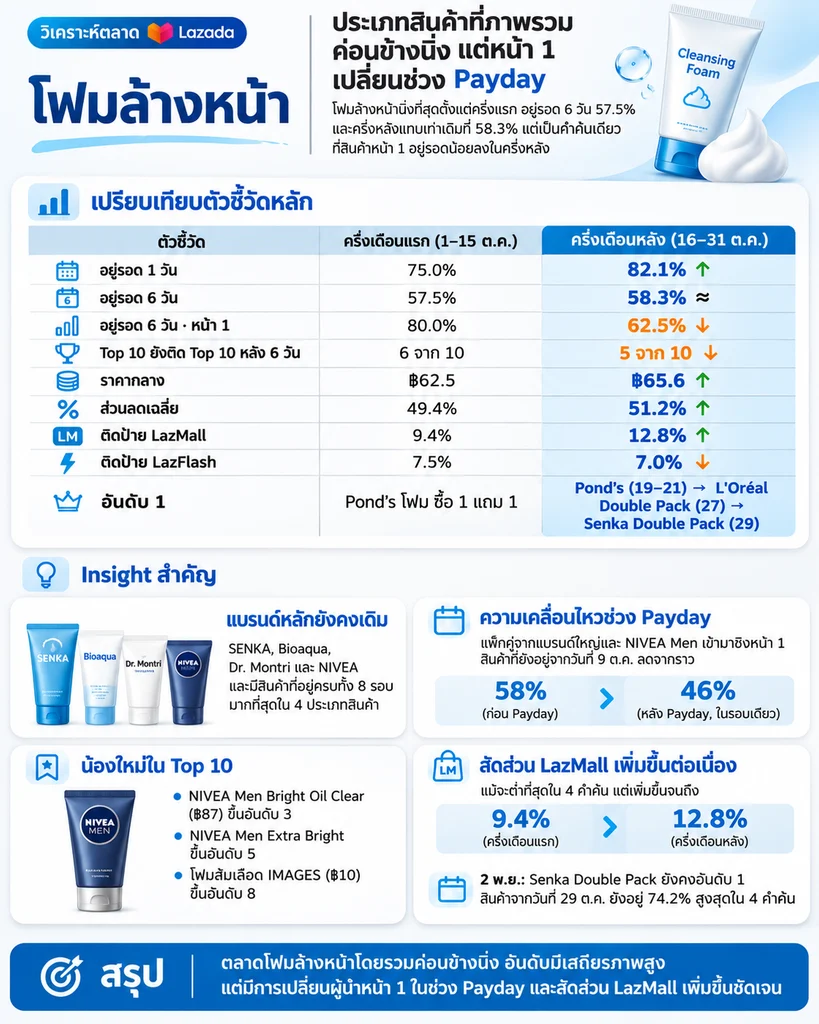
The cleansing foam category maintained consistent 6-day survival rates across both periods (57.5% vs. 58.3%). Consistently present brands included SENKA, Bioaqua, Dr. Montri, and NIVEA.
However, the Page 1 survival rate dropped from 80.0% to 62.5%. During the Payday period, multi-packs from major brands and men’s grooming products (such as NIVEA Men) pushed to the top, securing the #3 and #5 spots.
For Brands: Even if the overall market appears stable, competition on Page 1 remains dynamic. Beyond primary search keywords, monitor multi-pack bundling strategies, promotional pricing, and sub-category listings gaining traction on front-page placements.
From Marketplace Data to Marketing Action
Search ranking data holds the highest value when analyzed alongside prices, discounts, reviews, cumulative sales, and campaign periods.
Marketing teams can leverage this data to ask the right questions and unlock crucial insights:
- Competitor Analysis: Which rivals are steadily climbing the rankings? Is their growth tied to promotions or price cuts?
- Spot Emerging Trends: Which product types are capturing Top 10 spots more frequently? (e.g., value bundles, trial sizes, or premium lines)
- Measure Campaign Impact: How do keyword rankings shift before and after Mega Sales events like 10.10, Payday, or 11.11?
- Track Growth Momentum: Which products or storefronts are seeing a significant surge in reviews and “units sold” metrics?
- Re-evaluate Keywords: Are the keywords your brand is competing for truly aligned with your product category and actual shopper intent?
Caution: While front-end marketplace data helps build hypotheses and reveal broad market trends, it must always be cross-analyzed with internal brand data—such as actual sales, ad spend, and internal campaign performance—before drawing final conclusions.
5 Key Insights Brands and Marketers Shouldn’t Ignore
- Monitor Product Rankings in Real Time: Marketplace rankings can shift dramatically in just a few days. Consistent tracking ensures you instantly spot when competitors make a aggressive push, protecting your brand from losing critical search visibility.
- Track Insights Before, During, and After Major Campaign: During mega sales (such as 10.10 or Payday events), rankings experience extreme volatility—especially in high-competition categories like serums and sunscreens. Comprehensive monitoring across all campaign stages allows you to gauge market direction and adjust your plan in time.
- Focus on Sales Volume and Reviews Over Price Wars: Avoid relying solely on price-slashing to compete. Products that sustainably hold top positions are almost always backed by strong cumulative sales figures and significantly higher review counts.
- Beware of Duplicate Listings Cannibalizing Your Own Ranks: Creating multiple listings for the exact same item can cause your products to compete against one another. A key example is LBLS, where a newly launched listing jumped to #1, driving their existing listing down to #26.
- Select Keywords Precisely for Target Audiences: Using overly broad search terms introduces irrelevant product types into search results, skewing your data analysis and market findings.
Data is the Opportunity to See the Market Ahead of Your Competitors
The analysis of 4,320 skincare product listings on Lazada Thailand throughout October 2026 shows that each category exhibits distinct competitive patterns across rankings, pricing, promotions, and position retention capabilities. Key takeaways include:
- High Product Rank Volatility: Only 52% of products maintained their position on the same page for the entire month, while all remaining listings suffered rank drops.
- Top 10 Reshuffles Daily: Even for products that successfully stayed on Page 1 all month, their exact rankings shifted constantly—no single listing held a permanent spot.
- LazMall isn’t the Only Ticket to Page 1: Only 37% of products appearing on Page 1 carried the LazMall badge, proving that general sellers also have a real shot at making the front page.
- The Power of Reviews: Products listed on Page 1 boasted an average review count 3 times higher than those on subsequent pages.
Based on the insights above, continuous data tracking and analysis are vital to reading competitor moves in real time and leveraging actionable insights to refine your business strategy with precision.
Birth Note Services
Birth Note provides comprehensive data collection and analytics across leading marketplaces like Shopee and Lazada, covering:
- Market & Trend Analysis: Track market dynamics and emerging product trends across categories.
- Competitor Analysis: Analyze rivals across brands, products, pricing strategies, and competitive positioning.
- Product Ranking Monitoring: Track ranking shifts and position retention capabilities over time on online marketplaces.
- Price & Promotion Analysis: Analyze market pricing, discount depths, and promotional structures.
- Sales & Review Insights: Study platform-displayed sales metrics and review data to decode product momentum and consumer behavior.
Curious about how your market is evolving or what your competitors are doing on Shopee and Lazada?
Let Birth Note help turn raw data into strategic business insights to grow your enterprise.
Contact Birth Note
- Phone: 099-564-5947
- LINE OA: @birthnote
- Email: [email protected]
Important Data Limitations
(All figures are derived from search results of 4 keywords on Lazada Thailand—Facial Masks, Sunscreens, Serums, and Cleansing Foams—totaling 4,320 product listings in October 2026. This data represents search placement dynamics, not actual sales volumes or market share)
- Search Results Shift Constantly: Rankings fluctuate depending on the time of day and may be personalized to individual user behavior.
- Ad Placements Included: Sponsored ad listings (Ad) are intermingled with organic search results (Organic), causing greater rank volatility than normal.
- Displayed Prices Reflect Entry-Level Options Only: Product card prices display the lowest price point in a listing (ranging from trial pouches worth a few baht to premium bundles worth thousands). Thus, median prices reflect the product mix rather than price changes of an individual item over time.
- “Units Sold” Metrics are Cumulative: The numbers displayed on the platform show lifetime total sales, not sales generated specifically during the data collection period.
- Brand Count May Be Underreported: Approximately 37% of listings do not specify a brand tag in the system backend (even if the brand name appears in the title text), making the number of products per brand appear lower than in reality.
- Tracked by Listing ID: If an identical product is listed under multiple listings or by different sellers, each is counted as a separate entry. This may cause overall system retention rates to appear slightly lower than actual brand retention.
Want to know how your market is evolving or what your competitors are up to on Shopee and Lazada?
Let Birth Note help turn raw data into actionable business insights that drive real growth.
Call: 099-564-5947 | 096-142-9547 · We respond within 24 hours.
FAQ: Frequently Asked Questions About Skincare Trends on Lazada (2026)
A compilation of common questions regarding this report
📅 Last updated:

