The strategy of using QR Code stickers for a Loyalty Program to retain customers
The use of QR codes for loyalty programs has become a tool for increasing engagement with existing customers for various brands.

The use of QR codes for loyalty programs has become a tool for increasing engagement with existing customers for various brands.

Birth Note's Lucky Draw QR Code Stickers can help brand owners offer a chance to win prizes by completing an online survey.

Data visualization is the process of transforming data into visual representations, such as charts, graphs, tables, maps, and other forms.

3 main challenges in managing product warranties include complex processes, manual data entry, and limited reporting capabilities.

In the present, digital-savvy retailers often use QR Codes in creative ways to create and maintain customer loyalty.
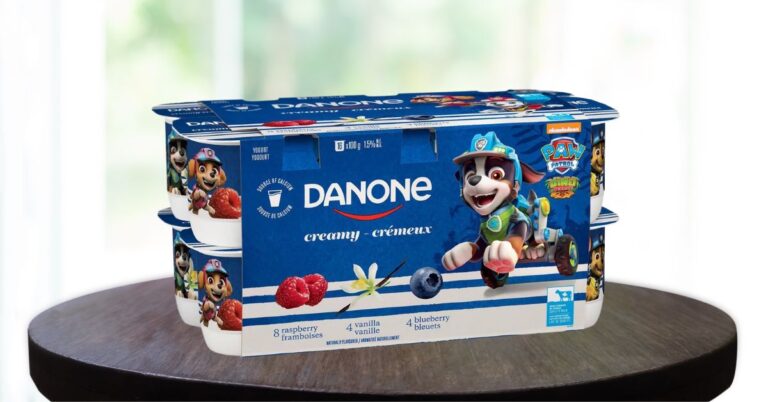
Danone in Spain prints QR codes on its packaging, allowing customers to scan the QR codes on the products they buy to earn points.

Repeat purchases, customer engagement, and acquiring new target customers have become key to business expansion and profitability.

QR code stickers are one of the most suitable solutions for preventing counterfeit goods, as they can prevent 100% counterfeiting.

Track the repair and maintenance of equipment, which may be industrial machinery, as well as equipment or property in the workplace.

Methods for collecting First-Party Data include surveys, tracking from Google Analytics, social media, subscriptions, door sensors, etc.